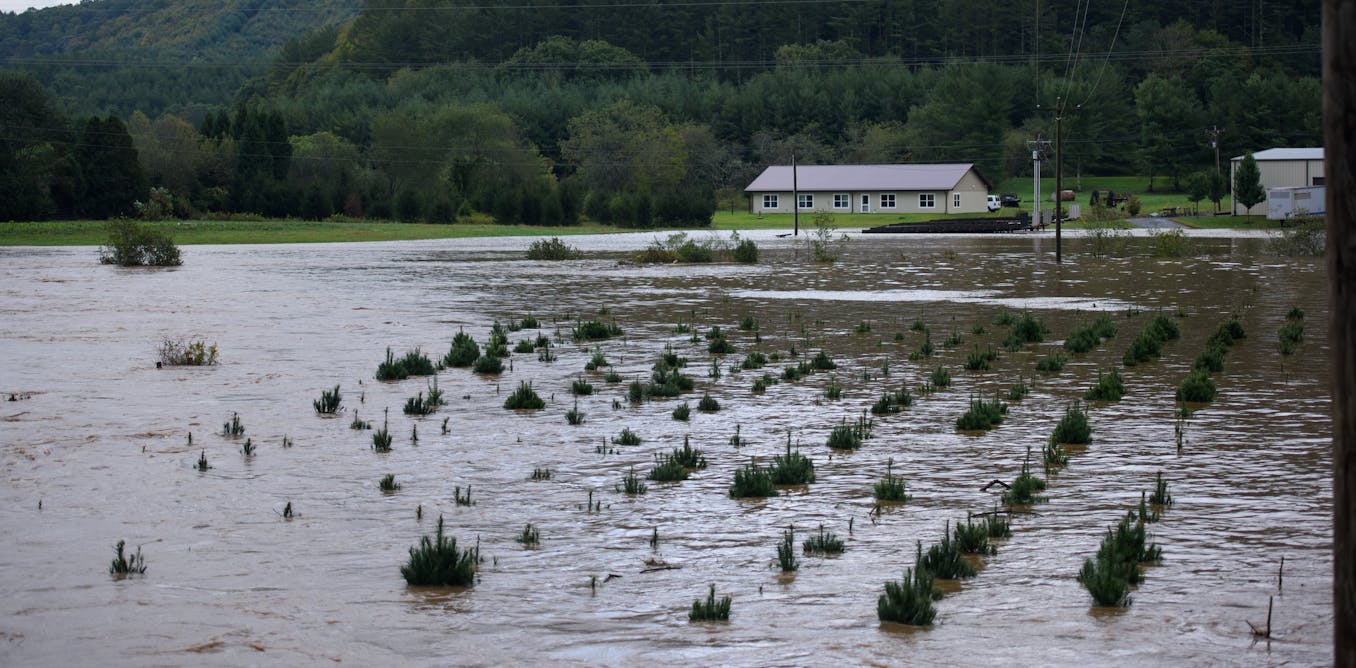
Hurricane Helene caused deadly and destructive flooding when it swept through the Southeast on Sept. 26-29, 2024. Across a broad swath of western North Carolina, where the worst flooding occurred, the amount of rainfall exceeded levels that would be expected on average only once every 1,000 years.
But this wasn’t the first 1,000-year rainstorm in North Carolina this year. In mid-September, an unnamed slow-moving storm produced more than a foot of rainfall closer to the Atlantic coast. This storm inundated areas that had already been drenched by Tropical Storm Debby in August.
As atmospheric scientists and state climatologists, we believe it’s important for the public to understand the risk that extreme events may occur. That’s especially true as climate change alters the conditions that create and feed storms. Here’s how scientists calculate storm probabilities, and why events like a 1,000-year storm can happen much more frequently in some places than that term suggests.
Russ Schumacher, Colorado State University
Forecasting the future based on the past
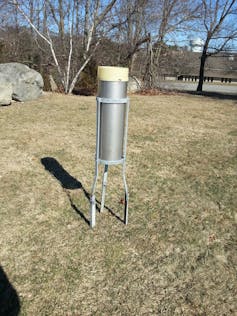
Estimates of rainfall return periods – how long it will be, on average, between storms of a given size – come from the U.S. National Oceanic and Atmospheric Administration, the home of the National Weather Service. NOAA publishes these projections in a series of reports called Atlas 14. Architects and engineers use them to design buildings, dams, bridges and other facilities to withstand heavy rainfall.
The estimates use past rainfall data to calculate how frequently rainstorms of various sizes occur at given locations. In places where historical rainfall observations have been collected for decades, it’s possible to calculate the amount of rain that is exceeded, on average, one or two times per year with very high confidence.
National Weather Service
Experts then use statistical methods to estimate how frequently larger rain amounts would occur. As the amounts get bigger, the calculations become less precise. But it’s still possible to make reasonable estimates of very rare rain events.
The results are average probabilities that a certain amount of rain will fall in a given location in any given year. If a storm that produces 6 inches (15 centimeters) of rain within 24 hours has a 1% chance of occurring in any year, then we would expect such a storm to happen once in 100 years, so its return period is said to be 100 years. An event with a 0.1% chance of happening in any given year could be expected to occur once in 1,000 years on average, so it is referred to as a 1,000-year event.
It’s not ‘one and done’
The problem with terms like 100-year event or 1,000-year event is that many people hear them and assume they mean another storm of that size shouldn’t occur for another 99 or 999 years. That’s a reasonable conclusion, but it’s incorrect. Each storm is an individual event, so just because one becomes unusually large doesn’t mean that another storm a year later can’t exceed the odds as well.
Imagine you’re rolling a pair of dice. The odds of throwing a pair of sixes is small – just 1 in 36, or slightly less than 3%. But if you roll the dice again, the odds don’t change – they are the same for that roll as the one before.
A more accurate way to communicate storm odds is to think about the annual exceedance probability – the chance that a rainstorm of a given size could occur in any single year. A 1,000-year storm has a 0.1% chance of occurring in any year, and the same probability of occurring again the next year, and the year after.
Russ Schumacher, CC BY-ND
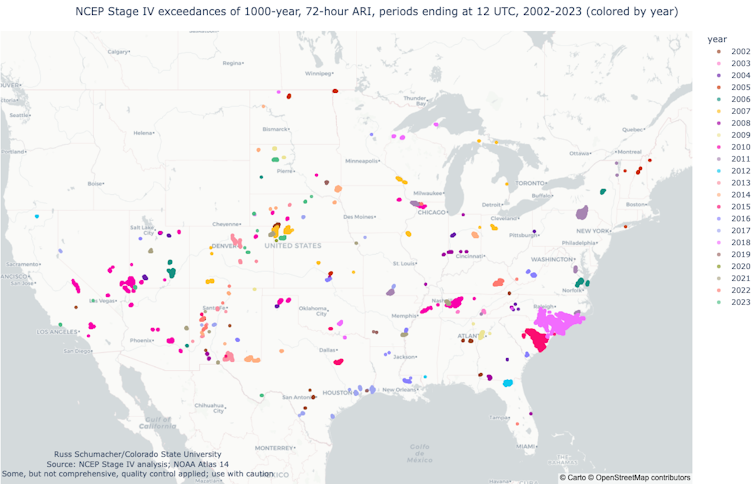
Since the U.S. is a big country, we should expect to see a bunch of 0.1% probability rainstorms every year. The chance of such a storm occurring at any specific location is extremely low, but the chance of one occurring somewhere becomes quite a bit higher.
Put another way, even if you are unlikely to experience a 1,000-year storm at your location, there likely will be 1,000-year storms somewhere in the country every year.
Different areas see different kinds of storms
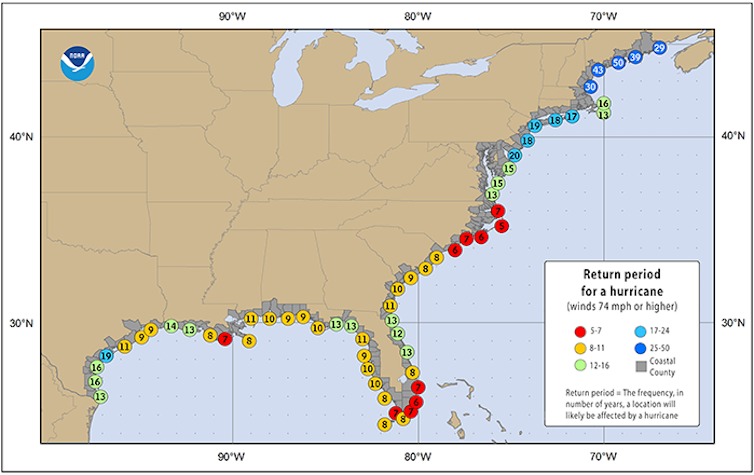
In the real world, actual rainstorms aren’t randomly distributed; they are a result of atmospheric processes like thunderstorms and hurricanes, which are produced by local and regional climate patterns. So a map of actual 1,000-year rainstorms would show clusters reflecting hurricanes along the East Coast, atmospheric rivers along the West Coast, and thunderstorm complexes in the Great Plains, where thunderstorm systems form.
Storm types matter because they have different durations. Almost all rare 1-hour extreme rainfall events are associated with thunderstorms, while those that last 48 or 72 hours often are caused by hurricanes or their remnants.
NOAA
North Carolina and South Carolina, which are frequently affected by hurricanes and tropical storms, have seen numerous extreme rainfall events in recent years. They include record-setting rainstorms in October 2015 in South Carolina; Hurricane Matthew in 2016; Hurricane Florence in 2018; the aforementioned nameless storm in September 2024; and now, Hurricane Helene.
In fact, since 2002, the three U.S. storms that have dropped 1,000-year magnitude rainfall on the largest areas have all hit the Carolinas: the October 2015 storm, Florence and Helene.
Loading the weather dice
Why have so many storms that, historically and statistically, should be exceedingly rare, struck the Carolinas in just a few years? There are two main reasons, which are related.
First, estimating the probability of rare events requires increasingly large amounts of data. NOAA’s Atlas 14 was last updated for the Carolinas in 2006, and those calculations only used data through 2000.
As more storms occur and more data is collected, the estimates get more robust. Given that reliable rainfall measurements only extend back about 100 years, the true probability of this much rain in the Carolinas may have been underestimated up until now.
Second, these statistics assume the climate isn’t changing, but we know that it is. Especially in regions near the coasts, the frequency of heavy rainfall has increased as a result of human-caused climate change. Warmer air can hold more moisture, and warmer oceans provide that moisture as the fuel for heavy rainfall.
As a result, climate change is making rainstorms that had been extremely rare now somewhat more likely. While the Carolinas may have been especially unlucky in recent years, the dice are also becoming loaded toward heavier rain – a trend that poses major challenges for emergency preparedness and recovery.
NOAA is currently developing Atlas 15, which will update current estimates with more recent data and will incorporate the effects of climate change. The agency also plans to modernize its estimates of a related quantity known as probable maximum precipitation, which is an estimate of the worst-case rainfall that could occur in a location.
Engineers use these estimates to design large critical facilities, such as dams, that can withstand the flood that would occur with the worst-case scenario rainfall at their sites. North Carolina has developed its own version of Atlas 15, due to the pressing need to plan transportation infrastructure to handle more events like Florence and Helene.
These updates will provide information that can be used for better planning and decision-making. Even so, extreme rainfall will still be a major hazard, with significant impacts on many U.S. communities.
The post “Why are so many historically rare storms hitting the Carolinas? Geography puts these states at risk, and climate change is loading the dice” by Russ Schumacher, Professor of Atmospheric Science and Colorado State Climatologist, Colorado State University was published on 10/02/2024 by theconversation.com



Leave a Reply